


The next DataDog for Data Observability
Deep-dive into the future of data observability

Data is old, and so does the data quality - Brief history of Data & Data Quality
The word data, derived from the Latin word datum, is defined as any granted fact that serves as the basis of calculations. The earliest prehistoric activities of humans storing and analyzing data can be traced back to 18,000 BCE when the tally sticks were invented. Paleolithic tribespeople would mark notches into sticks and bones to track daily activities, perform rudimentary calculations, and make decisions with the data they collected. Fast-forwarding to 3800 years ago, the first documented customer complaint about data quality was inscribed on a clay tablet. It described a man named Nanni, who complained to a copper seller named Ea-Nasir about the wrong grade of copper ore that had been delivered, and about the misdirection and delay of a further shipment. In the modern-day, that long “customer support ticket” is usually handled by software like Zendesk. Moving yet again to around the third millennia BC, writing started to evolve systematically, and with it, libraries. This collection and curation of written work could arguably be considered an early form of mass data storage.
All this is to say that data is old, and so is the issue of data quality. Accompanying the earliest production of data written into physical artifacts were numerous typos that were inscribed in cuneiforms, which brought many misunderstandings and complaints to our ancestors. Fast forward to today, our production, collection, storage, and use of data have grown by leaps and bounds. The digital transformation of data became the lifeblood of modern businesses and spawned the field of business Intelligence that dominates some of the most successful companies in recent history. However, the data’s success story wasn’t all smooth sailing. In 1970, computer scientist Edgar Codd from IBM recognized that data generated from multiple sources were normally stored in individual silos, so working with diverse data sources involved the difficulty of coalescing fragmented and disjointed information, which oftentimes led to data processing errors and produced questionable reports. To solve this pain point, he introduced the relational database model, which followed the tenet that most entities in this world can be linked through relationships. On top of that, the structured query language (SQL) was developed, which provided a set of well-defined operations and formalized relations of algebra to manipulate the data tables. The combination of relational database and SQL gained tremendous popularity and was later adopted worldwide.
Data quality problems got compounded by the accelerated development of modern data stacks (MDS). From 2013 and on, the introduction of Amazon Redshift(a brief origination of modern data stack can be found here), Google Big Query, Microsoft Azure, and Snowflake shrank the cost of storage and computing exponentially, allowing companies to attain much higher scalability. The modern data stack collects enormous amounts of data sprawled across dozens (if not hundreds) of applications, logs, events, and OLTP databases. Plus, more use cases are coming up - marketing strategy, user behavior predictions, go-to-market (GTM) operations (the team needs to put product data back to Salesforce), in-product intelligence, and automation to improve customer experience. With all the disparate use cases comes the inevitable data entropy of the modern data stack.
The data entropy of modern data stack
Put it simply, entropy measures the randomness or disorder of a system and is most commonly associated with a state of uncertainty. The value of entropy directly depends on the mass of a system.
The concept of entropy also applies to the modern data stack. Raw data, transformed data, BI data, and all their underlying data pipelines are rambling across different systems. With the evolving complexities of the modern data stack, the long-brewing problem of data quality has never been more pronounced. As a result, more and more data downtime and downstream data leakages are creeping into the data flow. The democratization of data – the rise of low-ops and no-code cloud data tools – has also worsened the data quality and reliability issues. The citizen data scientists and self-service BI analysts using those tools lack the training and knowledge to properly manage data at scale. As data entropy increases with data volume, the burdened and shackled data stack gest easily be short-circuited. And the cycle repeats itself in a downward spiral.
In addition to the disorder introduced by the exploding data volume, data elements themselves also have data quality issues, such as variance drift, data brokerage, stale data, missing values, and data inaccuracy. Those issues concerning data quality are not easy to solve and have incurred huge costs to companies. At a high level, data trust could be an abstract metric that outside of the entropy formula while it is most essential to the management. In daily operation, the downstream data consumers and key stakeholders look at metric dashboards to take a pulse of the state of the business, and if a barely noticeable missing value inadvertently caused a 25% decrease in the newly registered user metric, that one simple mistake could all of a sudden throw the business into an unnecessary frenzy.
Those aforementioned challenges, along with the fact that decades-old incumbent solutions on the market are defensive and reactive, present a compelling opportunity for improvement in the data quality monitoring space. Existing application performance management (APM) software mostly focuses on monitoring data repositories rather than checking data infrastructure health typically, when APM detects data quality anomalies, it will push a system alert to the data team without referencing the source, possible root causes, and potential outcomes. Add into the mix a flurry of superfluous and false-positive alerts that are sent through the system every day, the data team is often inflicted with alert fatigue as they are forced to divert precious engineering hours to resolve the issues.
Framework lesson from Datadog - The modern control theory for data observability
The name of DataOps is derived from DevOps. Conceptually, there are many similarities between the software development lifecycle and data development and operation lifecycle. Therefore, one can draw from the wisdom of software development management to reduce entropy in the data ecosystem and instill order. Similar to the world of data engineering, modern software engineering tech stack consists of multiple disparate components that run in the cloud (e.g. databases, Kubernetes clusters, API gateways, microservices, containers, etc), which makes it very difficult to systematically monitor the health and reliability of each part of the infrastructure. To tackle this problem, sophisticated infrastructure observability tools emerged to solve this pain point.
Before diving into the observability framework that has been validated by tech companies, I will start by going back to the origin of “observability” as a discipline, which could help us better understand the observability tools as a whole. The concept of observability comes from modern control theory, which deals with the control of dynamical systems in engineered processes and machines. The objective of modern control theory is to develop models or algorithms that govern the inputs to any system to ensure that the system reaches its desired state with maximum stability and optimality, with minimum delay, overshoot, and steady-state error. The theory consists of two important concepts: observability and controllability.
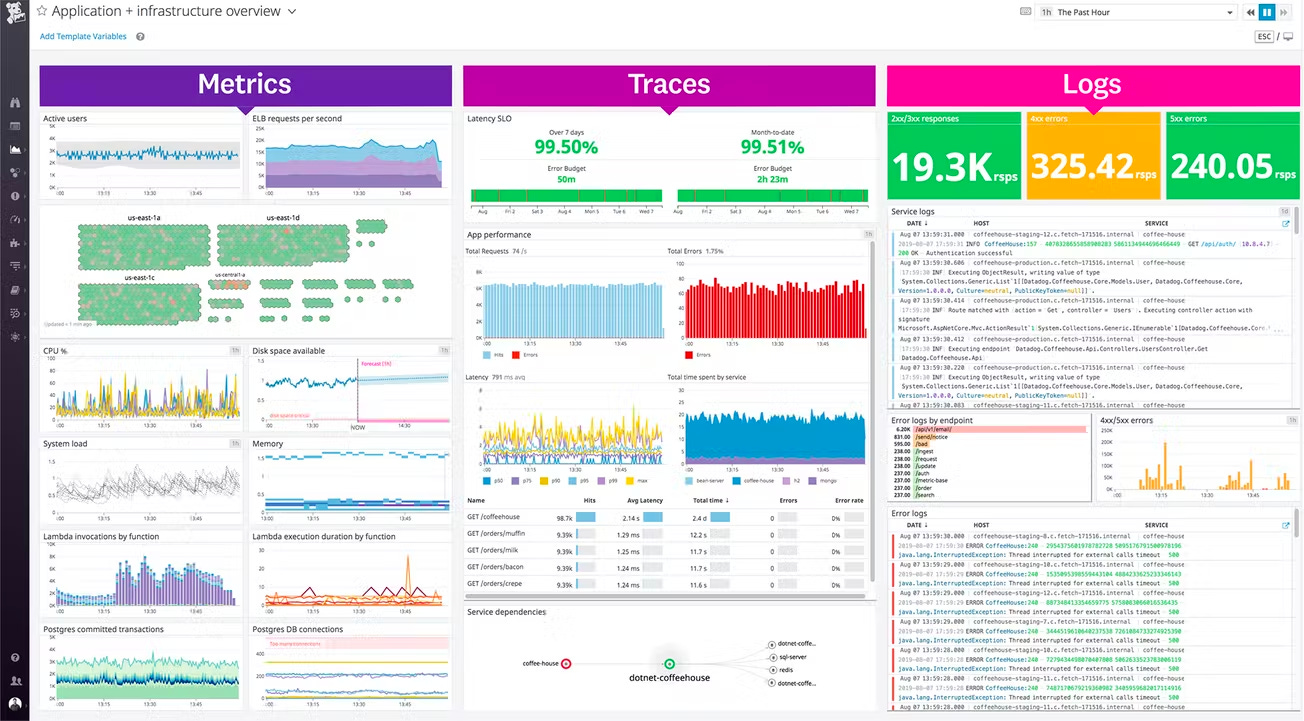
To concretely illustrate the ideas of observability and controllability, I will use DataDog as an example to demonstrate how the observability framework is used to maintain the stability of the engineering tech stack. DataDog is a full-stack infrastructure monitoring company that specializes in processing and analyzing metrics and events generated by applications and services running in customers’ infrastructure. Their main product offerings include APM, log management, user experience, and network performance monitoring. When it comes to monitoring diverse feedback coming from various applications, DataDog captures these three key elements to ensure success – metrics, traces, and logs:
Metrics - Measurements that infer the system’s internal characteristics. Datadog collects and visualizes numerous metrics and sets up alerts for potential issues to drive insights into the system’s performance and health
Traces - Time-series-based application performance.
Logs - A complete history of the system’s minor interactions with other services, applications, and platforms, with which DataDog can debug, audit, and analyze at scale
Those three byproducts, along with other system outputs and metadata, provide crucial data points for the engineering and infrastructure teams to monitor and respond to any software or cloud infra issues. In a similar vein, modern data observability platforms can also benefit from collecting and analyzing those three byproducts. But additionally, it should also fulfill the following needs of the modern data stack:
Automation - Automate the task of maintaining data consistency, such as data cleaning and reconciling data in motion
Root cause analysis - Slash the number of false positives and other unnecessary alerts by providing more insights into the root cause of data inconsistency and also tracing the downstream outcome
Predictability - The ability to predict potential data quality problems and empower the team to take preventive measures
So how can infrastructure monitoring tools like DataDog be adapted for the ever more complex modern data stack?
Decompose the modern data observability solutions
Enter modern data observability! The observability framework that arose out of DevOps best practices – metrics, traces, and logs – can establish a solid foundation with which DataOps can leverage and tailor to big data management. Logs in the data observability will describe the interaction between data and the non-data worlds such as data ingestion, transformation, and consumption. Finally, the metrics, just similar to the ones in the software development world, metrics describe the internal characteristics of data such as a single table in Snowflake - metric describes what’s the distribution of the column, the mean, and the standard deviation of the data.
In addition, data observability includes two more dimensions: lineage and metadata. Lineage documents the relationships between data. Without proper tracking of data lineage, dependencies between multiple data tables can quickly become convoluted when managing more than a few sources with multiple preprocessing steps that generate additional child tables. Metadata describes the external characteristics of data (“data about data”), such as the structure/layout of data (schema) when the data lands and materializes in the store. These two dimensions apply only to DataOps because data has more intricate interdependencies than software. A DevOps engineer can kill a buggy server and spin up another one without much of a fuss because a server is like a black box with well-defined input and output. But DataOps engineers cannot simply kill a column in a table, because that one column could be used to compute values in other tables, and its absence could result in big differences in downstream data output.
Example of modern data observability
After describing the framework of modern data observability using inspirations from infrastructure observability, we can now deep dive into the framework’s components and use cases by following the data operationalization journey of our fictitious technology company, Bumblebee. Simply put, Bumblebee provides a highly customized audio story subscription service to consumers. After completing a $50M Series A round, the company wants to overhaul its existing data infrastructure to create a modern data stack that can improve customer growth and enable real-time intelligence to create a more personalized user experience

The diagram shows a high-level overview of Bumblebee’s proposed MDS as it applies to user email signups. The tools and processes that are used are as follows:
Fivetran for data ingestion and data pipelining
Segment for data identification and user tracking
Snowflake as the data warehouse to store email registration data
dbt for data transformation to compute registration conversion, usage trends, and daily trial data
Looker as the “last mile” of Bumblebee’s data delivery journey, providing business analytics and integrated insights to stakeholders, and potentially feeding the results back into sales/GTM applications like Salesforce
Interspersed between these components of Bumblebee’s modern data stack are data observability tools that are critical for monitoring and optimizing the company’s end-to-end data journey.
Imagine we, as data engineers, want to track the health of the company’s data pipelines, so we are collecting metrics and metadata such as the number of rows in each table, summary statistics of the numeric columns, and refresh rate of the tables, etc. As new data is continuously generated and appended to the tables, the row count for, let's say the usage_30d table, is expected to increase linearly over time. So what happens when all of a sudden the data team starts to observe a 40% dip in the table’s row count? Well, if we were using conventional APM tools typically seen in the MDS, we would usually set up the alerts manually based on simple criteria, e.g. if the average rate of row append drops below a certain threshold, alert the team of the anomaly. However, with such basic rules, we won’t get any indication of the cause behind the 40% dip. So at this point, we are left with a dilemma: do we stop Fivetran, Snowflake, Segment, and other tools that are still piping data without raising errors, or do we let them run as we try to diagnose the situation and catch the silent bug?
Well, this is where the aforementioned modern data observability tools and framework can be a great help! A properly maintained data lineage can serve as bi-directional data quality checks. Data lineage can look upstream and record the parent tables that derived the usage_30d table. If the data come from the usage, the table came from track and the tracking table ultimately came from Segment. Now we know which tool and component may be responsible, and can trace to the upstream data source to find the root cause and correct the error. Data lineage can also look downstream to anticipate potential negative impacts to other data pipelines and help triage and send out alerts based on severity. With this more intelligent alerting system in place, we as data engineers can focus on answering business-critical questions such as “what is the downstream business impact of this 40% shrink in daily usage?” Maybe the dip isn’t related to data pipeline issues at all, but rather due to changes in user behaviors. In that case, we can work with the sales and marketing teams to add additional metrics to the Looker dashboard on Salesforce to further diagnose the root cause in market dynamics. The important thing to note here is that with modern data observability tools we as data engineers can have more confidence in the integrity of our data pipelines.
Market outlook
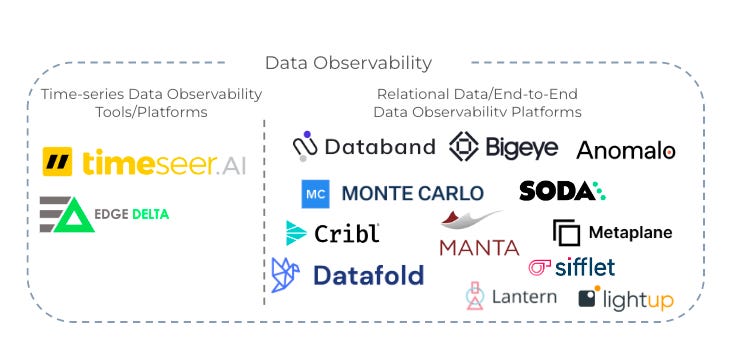
Based on the framework, ideal use cases, and modern data observability tool ideations, let’s look into the existing landscape and what is most exciting! There are more and more modern data observability tools (i.e. Metaplane) and platforms emerged in the market over the past year with some the platform companies like Monte Carlo, BigEye, and Cribl that have pocketed hundreds of millions from investors and are expected by them to become the next Datadog data observability for MDS.
There are different approaches taken by companies and we can categorize them by the degree of automation; different types of target observability for data. Time-series data are serial time-based data that are generated in time sequences such as IoT devices. Companies like EdgeDelta are capable of cleaning and reconciling data on the edge to make sure the cleanness of data schema and format before processing into the data stack. timeseer.ai also focuses on time-series data quality monitoring and observability. And moving out of a type of data, these companies have also evolved into ML-drive or automated observability tools 3.0, companies like BigEye, and Databand analyze trends in the data and automatically recommend data quality metrics to start tracking for a particular asset and propose automation features, like dynamic pipeline runs which seek to ameliorate the performance of the data pipeline.

As Datadog has become one of the most influential and iconic companies in the software and infrastructure observability space, the next DataDog for data observability is the next huge thing investors in the DataOps are looking for. Challenges remain in the space like customer buy-in (here’s a great post from the CEO of Metaplane that address the internal ROI of data observability solutions), enterprise budgeting, sweet-spot use cases plus the GTM angles, Data observability is just getting started with huge potential to solve the data quality and high-level data trust problem within more connectors built, more detailed lineage and deeper insights into data health.
